
Latvian Consumer Prices Rise Slightly in February
Consumer prices in Latvia edged up 0.2% in February 2026 compared to January 2026, according to recently released data. The increase was primarily driven by rising costs in the transportation, recreation, alcohol and tobacco, housing, and food sectors, partially offset by decreases in personal care and various goods and services.
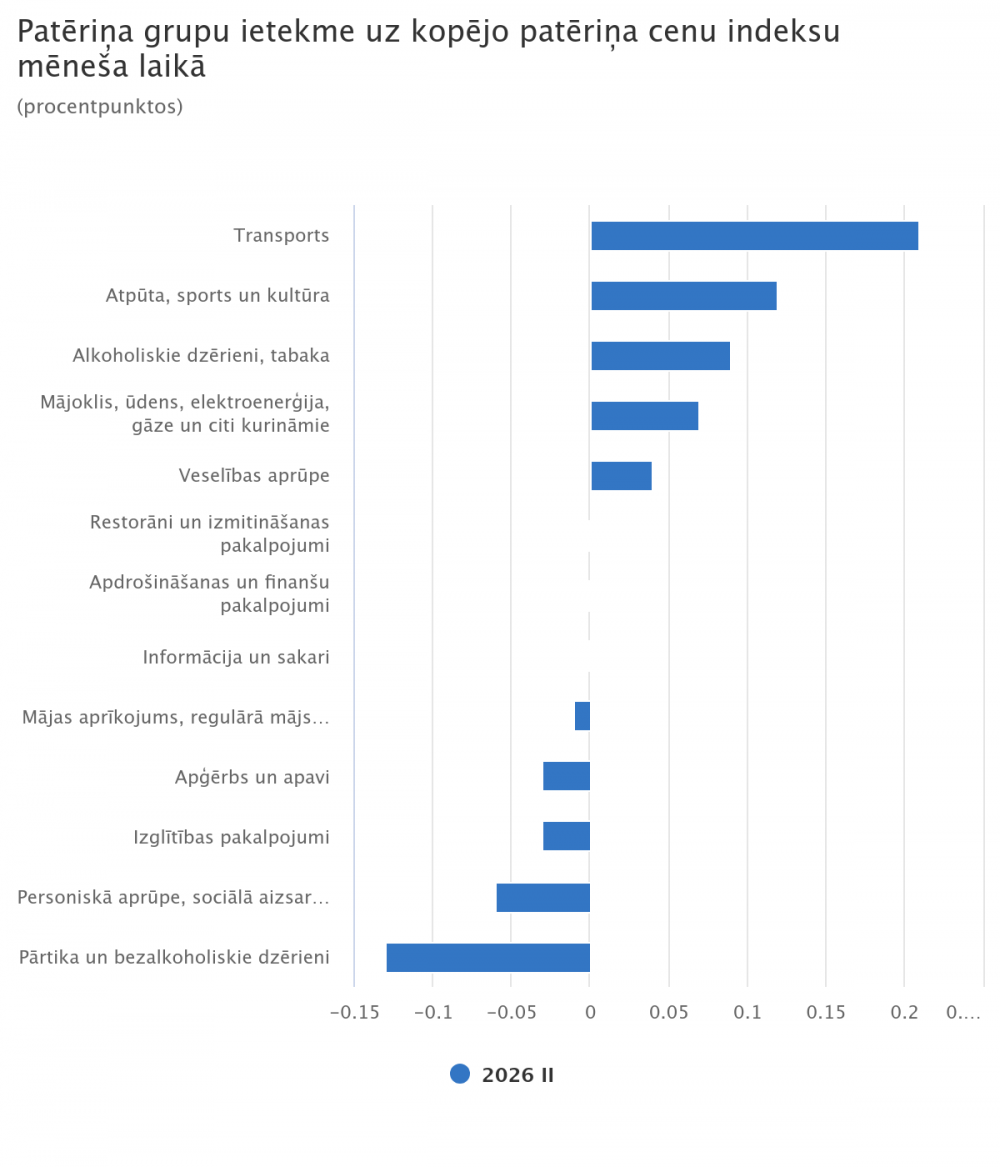
Food and non-alcoholic beverage prices declined by 0.6% during the month, largely due to promotional discounts on meat products, which fell 3.7%. Butter prices also decreased significantly, down 9.4%, alongside decreases in skim milk (-5.2%), soft drinks (-6.4%), cheese (-1.1%), dried, salted, or smoked meat (-1.6%), other flour-based confectionery (-1.2%), and chocolate (-1.3%). Prices also fell for fresh or chilled pork (-1.4%), olive oil (-7.0%), fruit and vegetable juices (-3.1%), and potatoes (-3.9%). Conversely, prices increased for fresh or chilled vegetables (+10.7%), fresh or chilled leafy vegetables (+10.1%), dried, salted, or smoked fish (+8.7%), spices, culinary herbs and seeds (+6.9%), other fresh fruit (+5.7%), fresh berries (+4.9%), and dates, figs and tropical fruits (+3.4%).
The average price level for alcoholic beverages and tobacco rose by 1.2%, driven by a 6.1% increase in cigarette prices. However, alcoholic beverage prices decreased by 1.6%, influenced by promotions on spirits and liqueurs (-2.5%) and wine (-1.6%).
Housing, water, electricity, gas, and other fuels saw a 0.4% increase in average prices, primarily due to a 5.9% rise in solid fuel costs. Materials for housing maintenance and repair also became more expensive, increasing by 1.6%. Electricity prices rose by an average of 0.2%, while the average price level for heat energy decreased by 0.4%.
Healthcare costs increased by 0.6% during the month, largely due to price increases for pharmaceuticals and dental services. This data reflects the ongoing pressures on healthcare costs within the Latvian economy.
Transportation costs increased by 1.7%, primarily driven by rising fuel prices, with diesel fuel up 3.8%, gasoline up 2.8%, and autogas up 0.3%. Prices also increased for passenger air transport and the maintenance and repair of personal vehicles, while tire prices decreased.
Recreation, sports, and cultural services saw a 1.2% increase in average prices, driven by higher costs for package holiday services and garden, plant, and flower products. Pet products also became more expensive due to promotional adjustments. Book prices, however, declined during the month.
Prices for personal care, social security, and various goods and services decreased by 1.3%, largely due to promotional discounts on personal care items and childcare services.
Other consumer groups saw notable price increases for other household services. Price declines were observed in pre-school education, clothing, and household furniture.
Year-over-Year Consumer Price Level Increases 2.3%
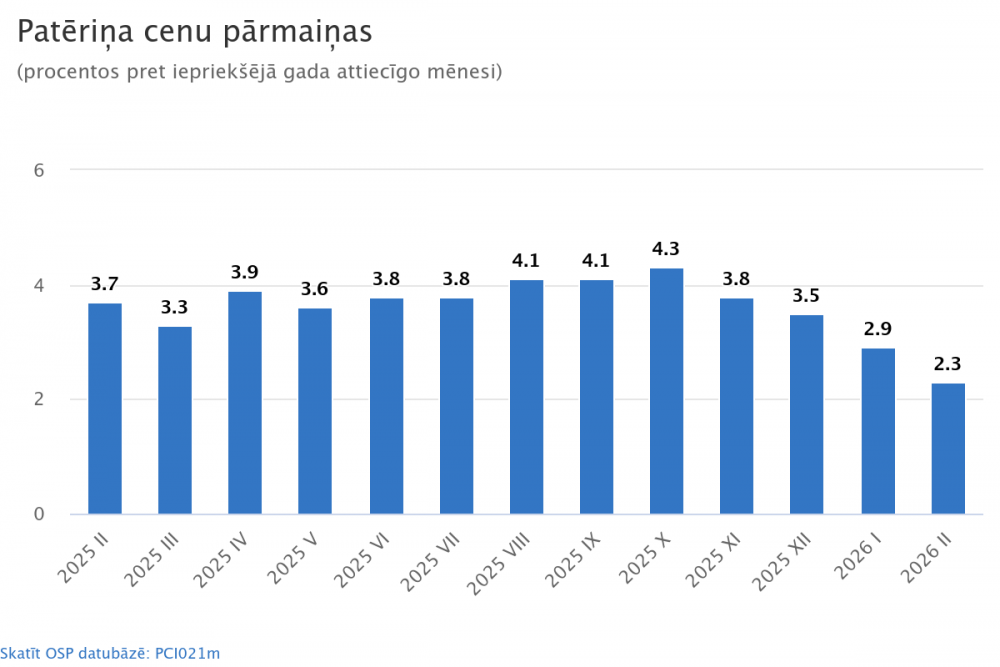
In February 2026, the average consumer price level increased by 2.3% compared to February 2025. The largest impact on the change in the average consumer price level came from housing, water, electricity, gas, and other fuels (+0.9 percentage points), primarily due to increases in heat and electricity costs, and food and non-alcoholic beverages (+0.7 percentage points). Significant impacts also came from healthcare (+0.3 percentage points), clothing and footwear (+0.2 percentage points), and a decrease in the transportation group (-0.2 percentage points).
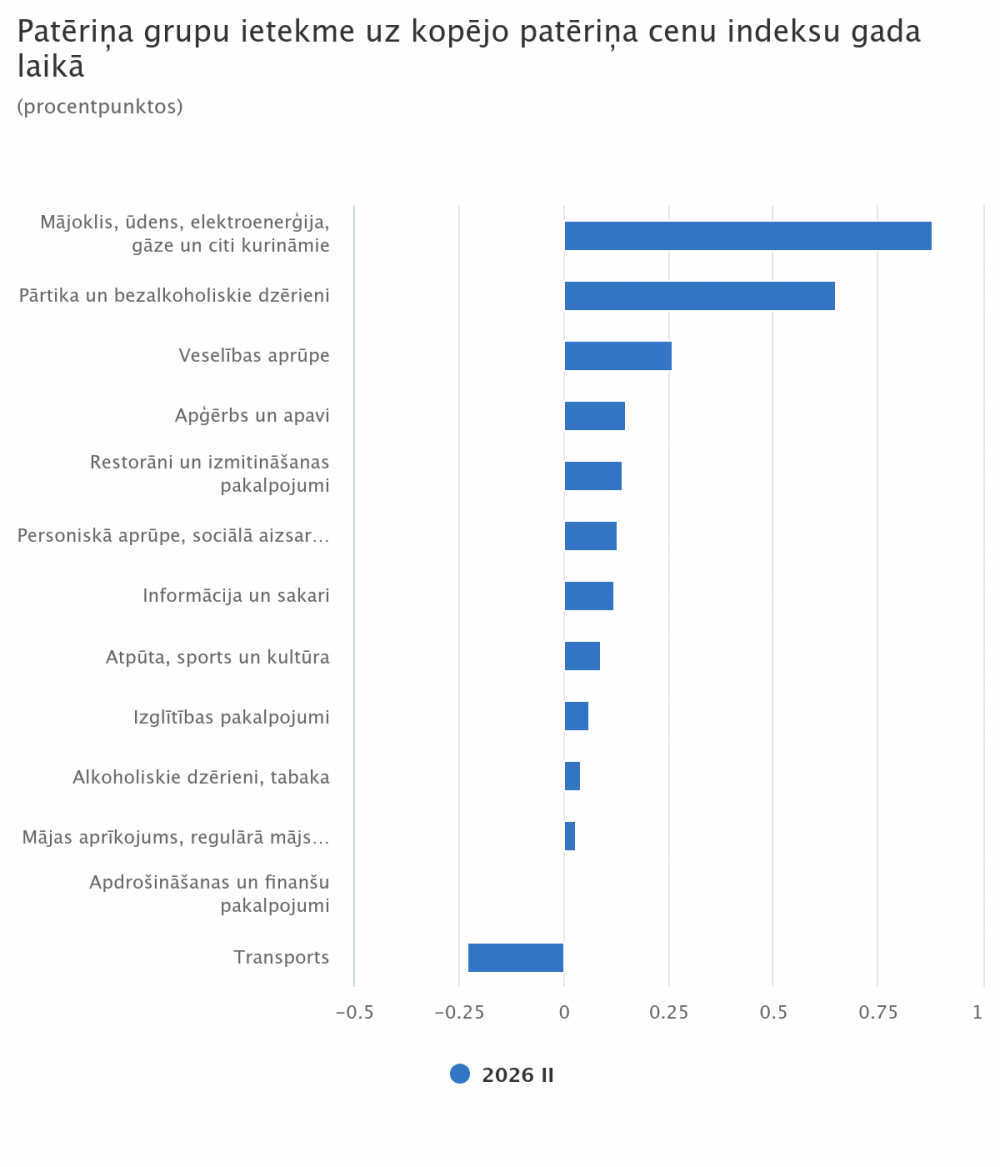
Food and non-alcoholic beverage prices increased by 2.4% year-over-year, with the most significant impact coming from coffee (+16.7%), fresh or chilled chicken (+12.2%), fresh or chilled vegetables (+15.6%), eggs (+18.2%), chocolate (+10.4%), and other flour-based confectionery (+3.6%). Prices also rose for dried, salted, or smoked fish (+29.9%), fresh citrus fruits (+19.0%), dried, salted, or smoked meat (+5.3%), and fresh or chilled beef (+23.1%). Conversely, butter prices fell by 19.9%, olive oil by 22.5%, potatoes by 17.2%, dates, figs and tropical fruits by 11.9%, meat products by 2.3%, and skim milk by 5.1%.
Clothing and footwear prices increased by an average of 2.9%, with clothing prices rising 2.3% and shoes and other footwear becoming more expensive by 5.9%.
The average price level for housing, water, electricity, gas, and other fuels increased by 5.3% year-over-year. The most significant price increase was for heat energy (+4.4%). Electricity prices also rose (+5.1%), as did water supply (+9.7%), solid fuel (+7.3%), sewage services (+13.0%), housing maintenance fees (+3.9%), housing rental fees (+6.4%), and natural gas (+5.8%). Prices also increased for housing maintenance, repair, and security services (+6.5%) and waste collection (+5.0%). Materials for housing maintenance and repair, however, became cheaper (-1.3%).
The average price level in healthcare rose by 4.1% year-over-year, with increases in ambulatory medical and rehabilitation services, dental services, pharmaceuticals, and medical imaging and laboratory services.
Transportation prices decreased by an average of 1.7%, primarily due to a 6.2% decline in fuel prices. Diesel fuel became 5.4% cheaper, gasoline 7.8% cheaper, and autogas 3.5% cheaper. Prices also fell for spare parts and accessories for personal vehicles. However, prices increased for personal vehicle maintenance and repair, other services related to personal vehicles, passenger transport by road, and passenger transport by rail.
The average price level in information and communication increased by 2.5%, driven by higher subscription fees for audiovisual streaming services and bundled telecommunications services, as well as mobile communication services. Computer prices, however, decreased.
The average price level in restaurants and accommodation services increased by 4.4%, with higher costs for catering services, including a 5.2% increase in restaurant and cafe services and a 5.6% increase in canteen, cafeteria, and school cafeteria services.
Prices for personal care, social security, and various goods and services increased by 3.2%, with higher costs for jewelry and watches, hairdressing and beauty salon services, and care home fees.
In other consumer groups, the most significant price increases were for cigarettes, higher education, and sports services. Prices fell for strong alcoholic beverages and liqueurs, wine, and beer.
Changes in Consumer Prices by Group (Percent)
| Changes in Prices in February 2026, Compared to: | |||
| February 2025 |
December 2025 |
January 2026 |
|
| Total | 2.3 | 0.2 | 0.2 |
| Food and Non-Alcoholic Beverages | 2.4 | -0.2 | -0.6 |
| Alcoholic Beverages, Tobacco | 0.6 | 2.4 | 1.2 |
| Clothing and Footwear | 2.9 | -5.0 | -0.6 |
| Housing, Water, Electricity, Gas and Other Fuels | 5.3 | 2.8 | 0.4 |
| Household Equipment, Regular Household Maintenance and Appliances | 0.9 | 0.0 | -0.3 |
| Healthcare | 4.1 | 1.9 | 0.6 |
| Transport | -1.7 | -1.6 | 1.7 |
| Information and Communication | 2.5 | 0.3 | -0.1 |
| Recreation, Sports and Culture | 1.4 | 0.5 | 1.2 |
| Education Services | 5.1 | -2.8 | -2.9 |
| Restaurants and Accommodation Services | 4.4 | -0.5 | 0.0 |
| Insurance and Financial Services | 0.5 | 0.5 | -0.2 |
| Personal Care, Social Security, Various Goods and Services | 3.2 | 0.4 | -1.3 |
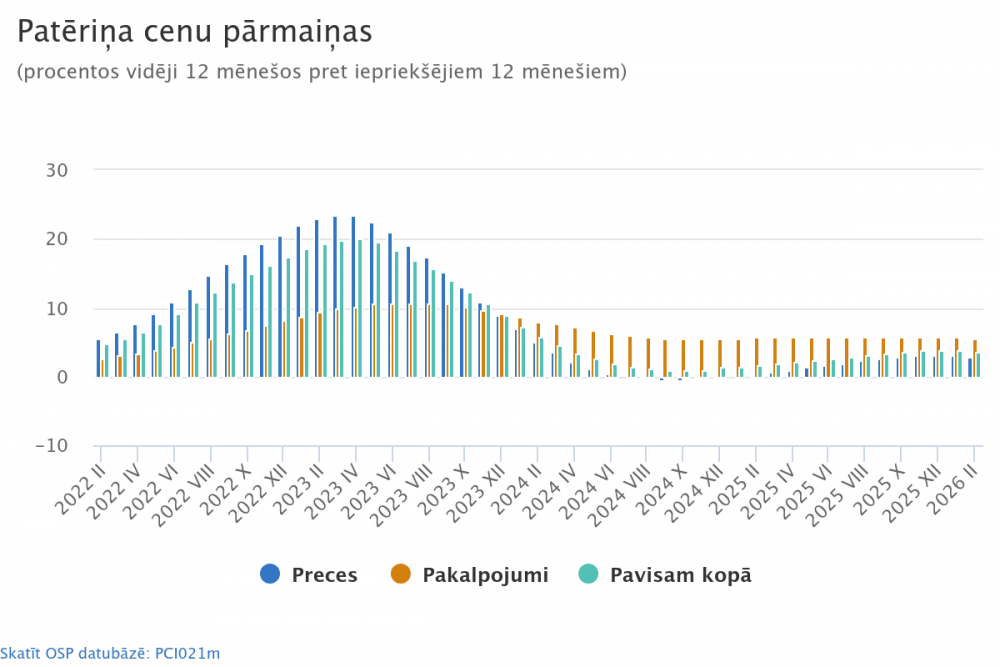
Compared to 2025, consumer prices in February 2026 were 0.8% higher. Prices for goods increased by 0.5%, while prices for services increased by 1.8%.
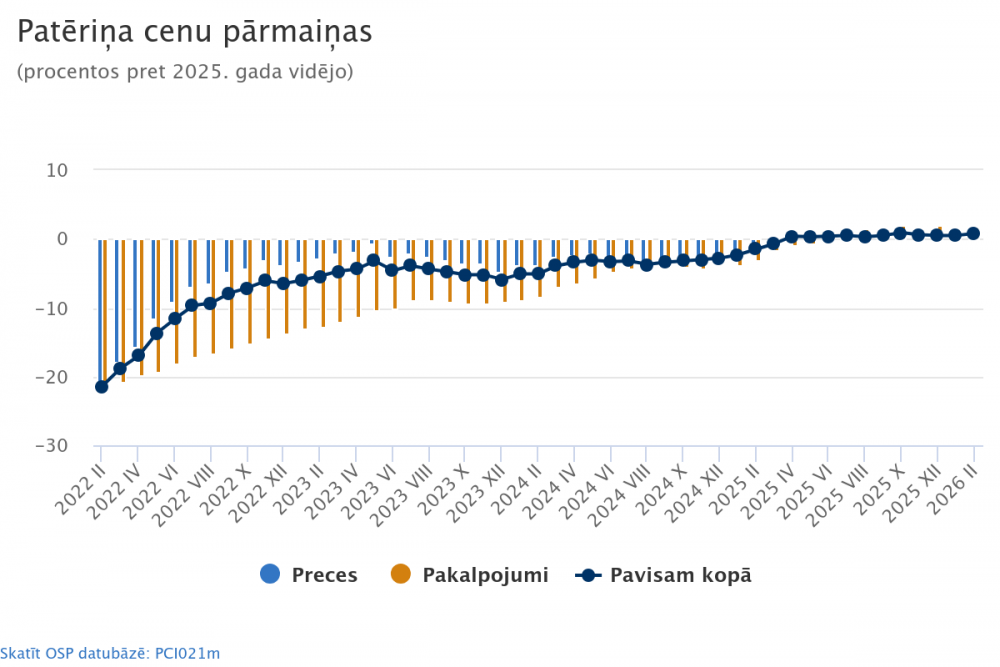
The average consumer price level in February 2026, compared to the previous 12 months, increased by 3.6%.
Information on changes in consumer prices for March 2026 will be announced on April 10th.
* Year-on-year inflation reflects changes in consumer prices, comparing the average price level for the reporting month with the average price level for the corresponding month of the previous year.
Methodological Information:
The Consumer Price Index survey is a sample survey with a targeted sample at all levels. It is conducted monthly from the 4th to the 20th, with price registrations evenly distributed throughout the survey period. In 2026, the CPI sample includes 558 goods and services for which prices are regularly recorded. Approximately 2,000 different trading and fee-based service establishments are surveyed. Approximately 23.7 thousand prices are observed each month.
More information on changes in consumer prices is available on the official statistics portal in the “Consumer Prices” section.